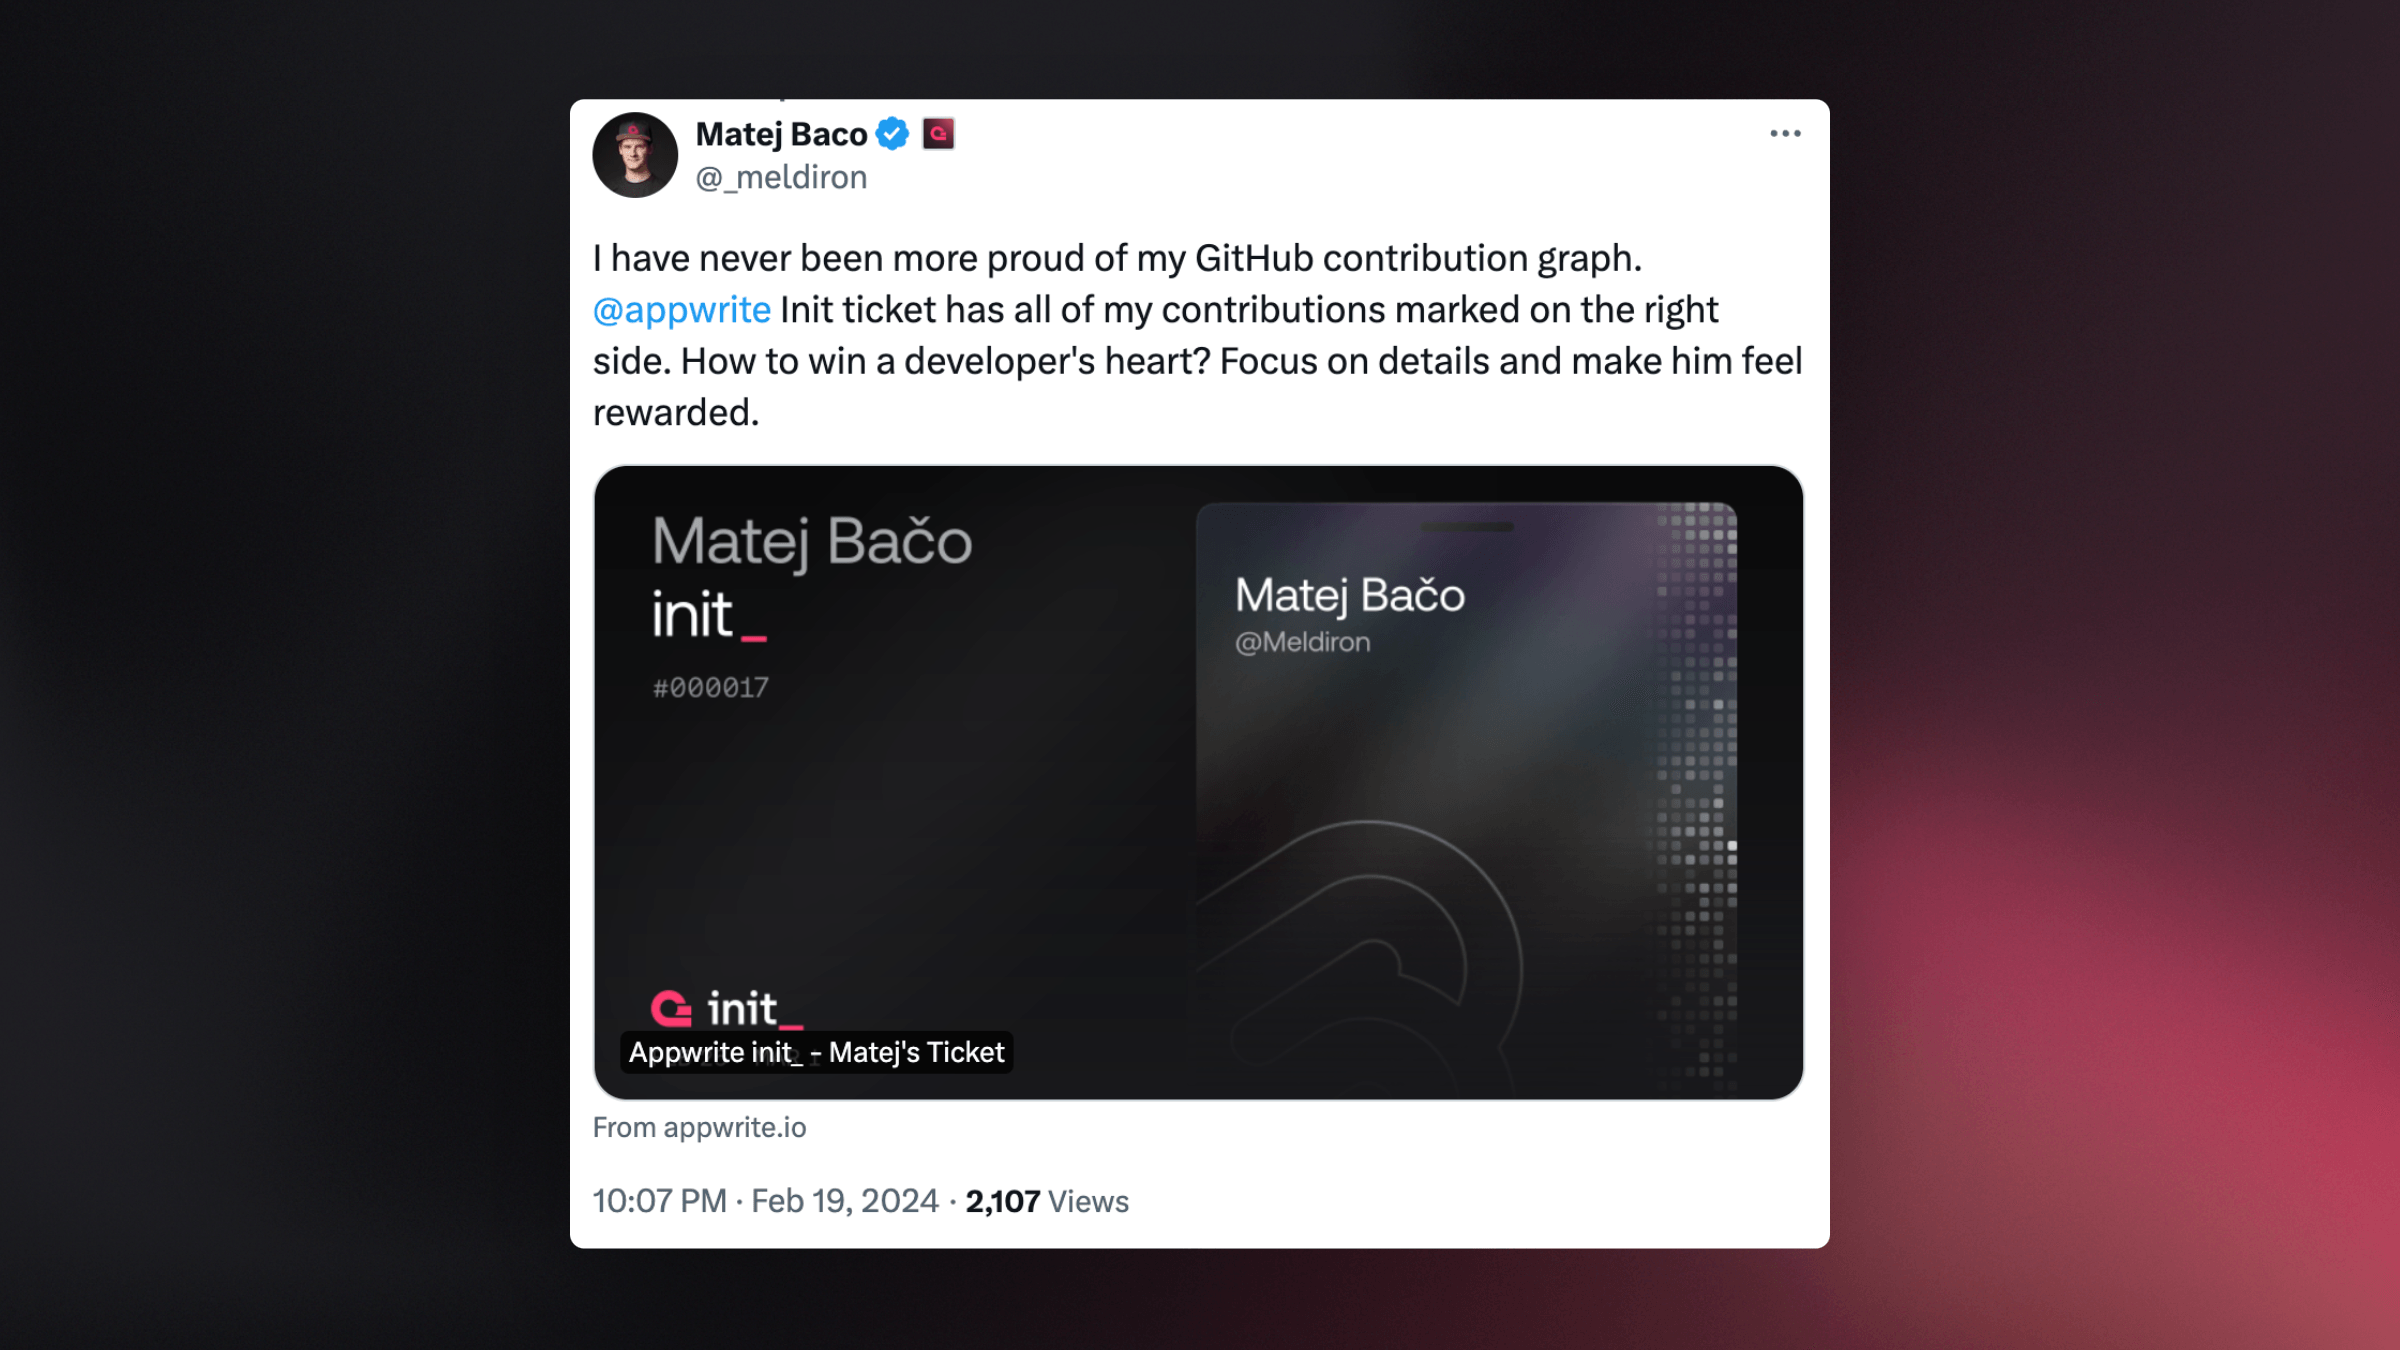
Do you remember the Appwrite Cloud cards? They were an absolute hit and filled our entire timeline for days. For Init, we wanted to create a new card, or better yet, a ticket to celebrate in style. So, we created three types of tickets that are unique to you with the help of your GitHub contributions and the tribe customization.
As always, we want to share our learning so you can create your own tickets with GitHub OAuth and grid integration.
Ticket design inspiration
Let’s start with the inspiration for the tickets. A few team members went to GitHub Universe in November 2023 and received a unique, customizable event badge with a grid on the side. These physical event tickets inspired our very own Init tickets that would convey the feeling of a real ticket to an event.
We took this idea, made it our own, and created three different types of tickets that would celebrate Init. The different types are categorized into:
Init celebration
Developers building with Appwrite
Appwrite contributors
Depending on your specific situation, you get a certain type of card that you can then customize and personalize.
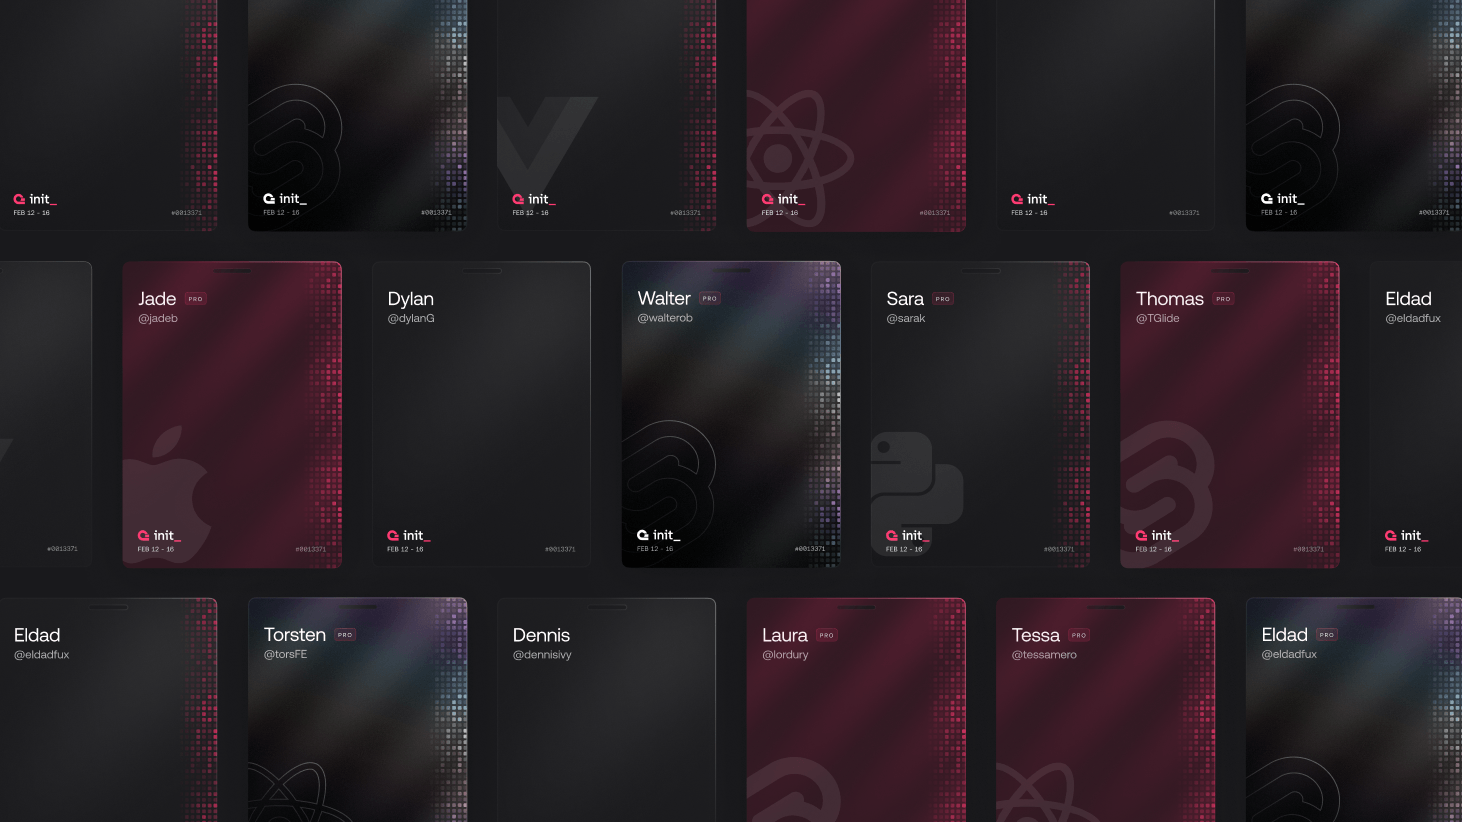
Here is an overview of the three design types.
Init celebration
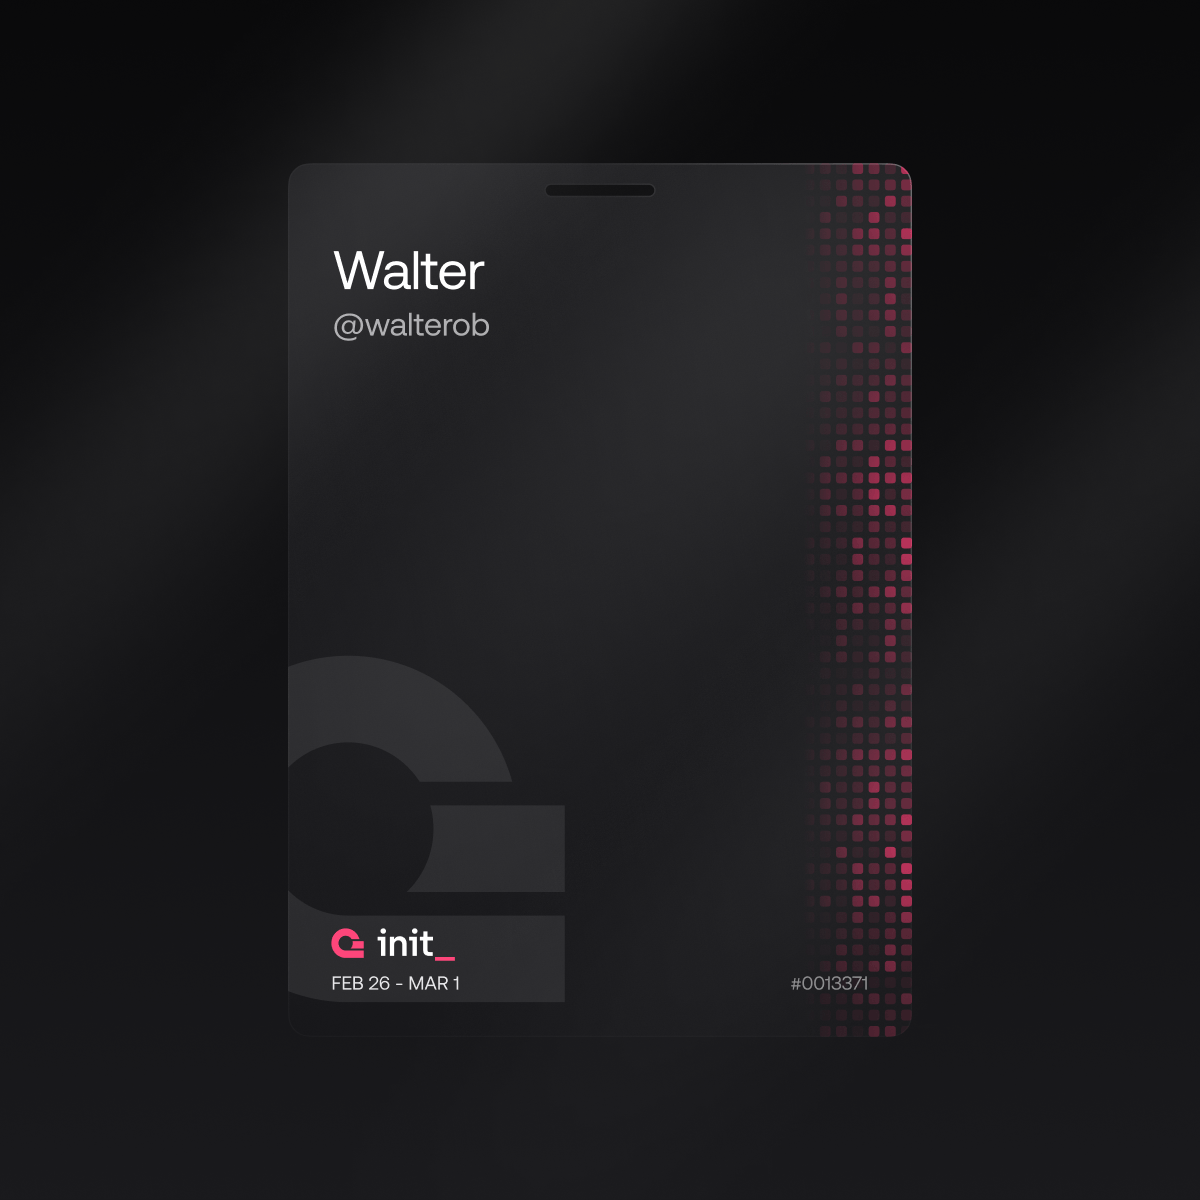
The Init celebration ticket is what everyone gets at sign-up. This is your starting point.
Building with Appwrite
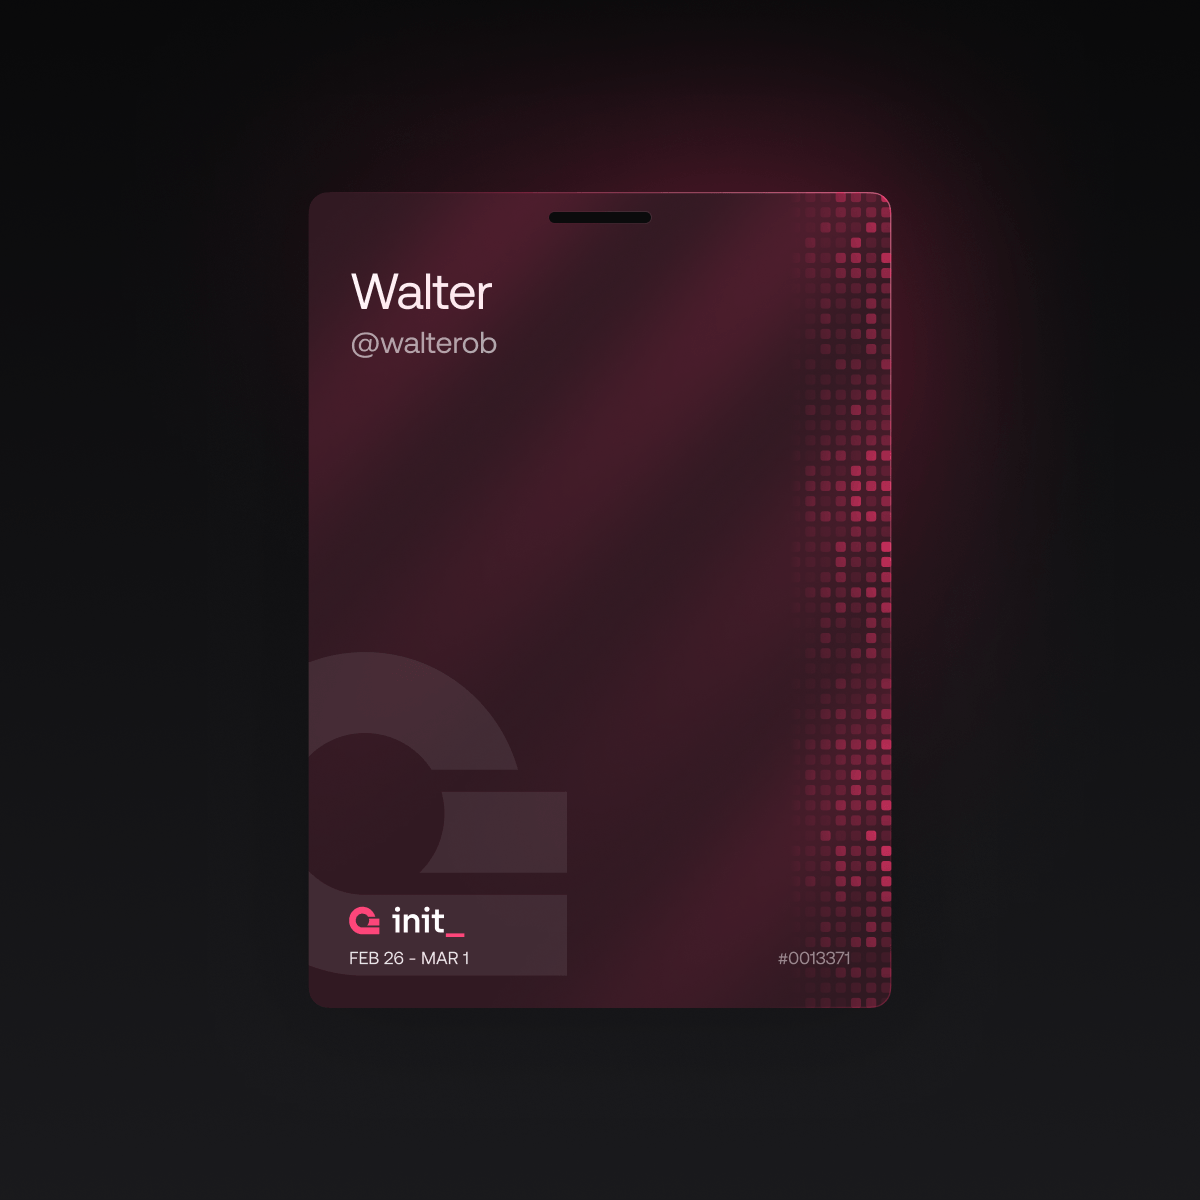
The Appwrite ticket is for all developers with an Appwrite account. They get a pink ticket with an extra pink glow.
Appwrite contributors
Then, we have one very special ticket dedicated to contributors of Appwrite. If you have contributed to Appwrite in any way, you will get this special design. It’s a platinum card with a rainbow glow.
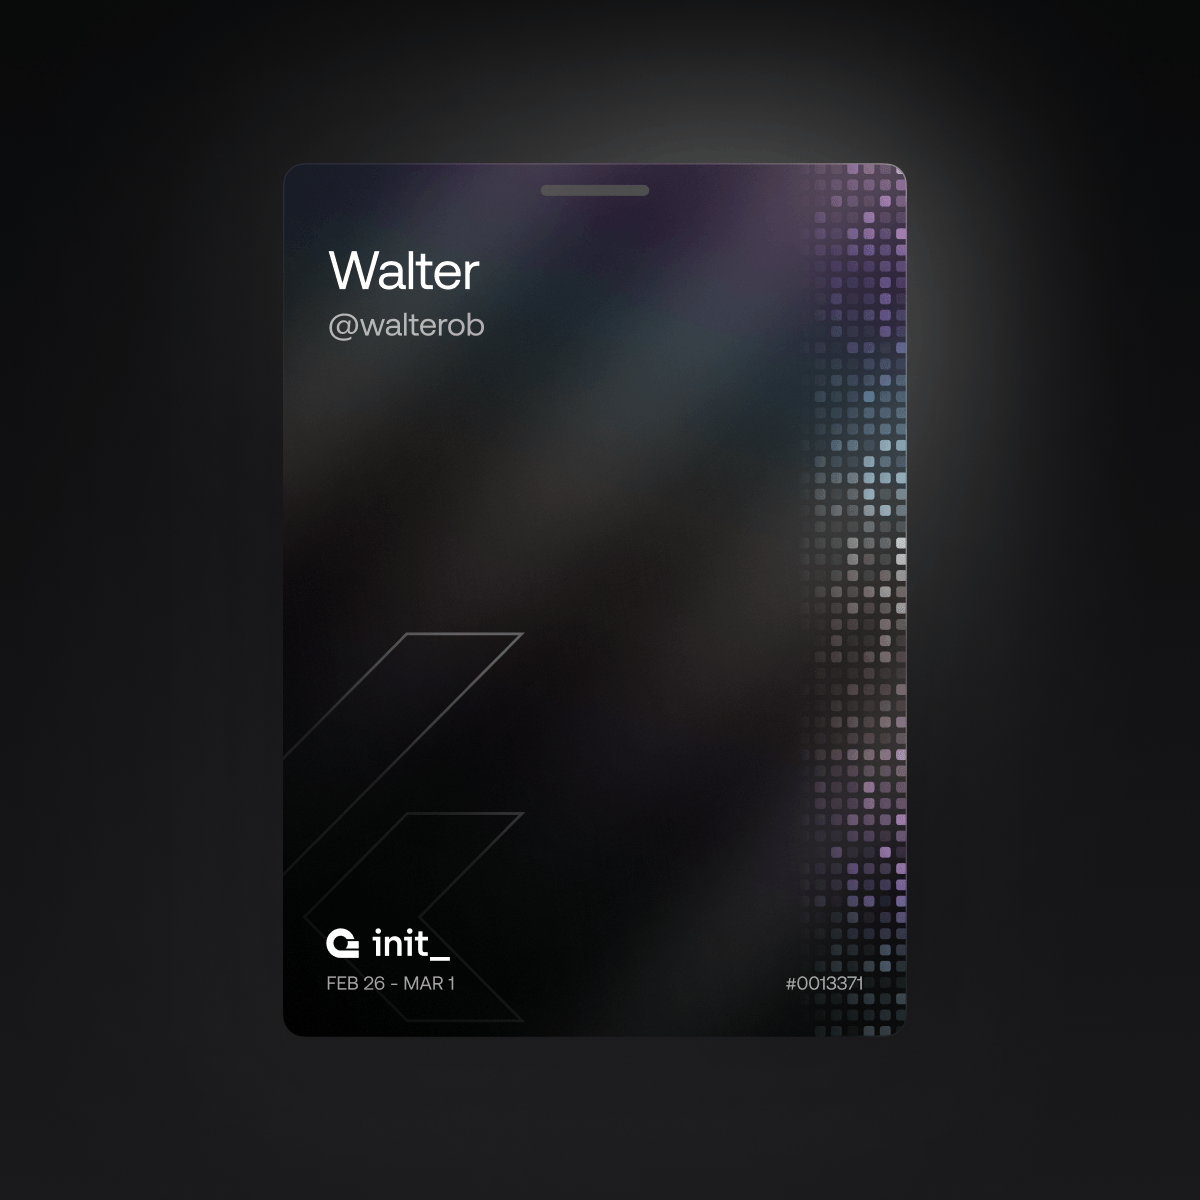
Show off your GitHub contributions grid
An essential part of the ticket is that we wanted to emphasize the importance of contributing to open source. What better way than showing off your actual contributions within your ticket?
As you can see on each side of the ticket, a grid resembles your unique GitHub contributions over the past year, just like on your GitHub profile. You can choose to add the grid with a toggle, but to do so, you need to connect your GitHub account.
Now, in case you would like to know how you can do this, we asked the engineer in charge, Thomas G Lopes, to explain the process.
Associating your GitHub account with your ticket
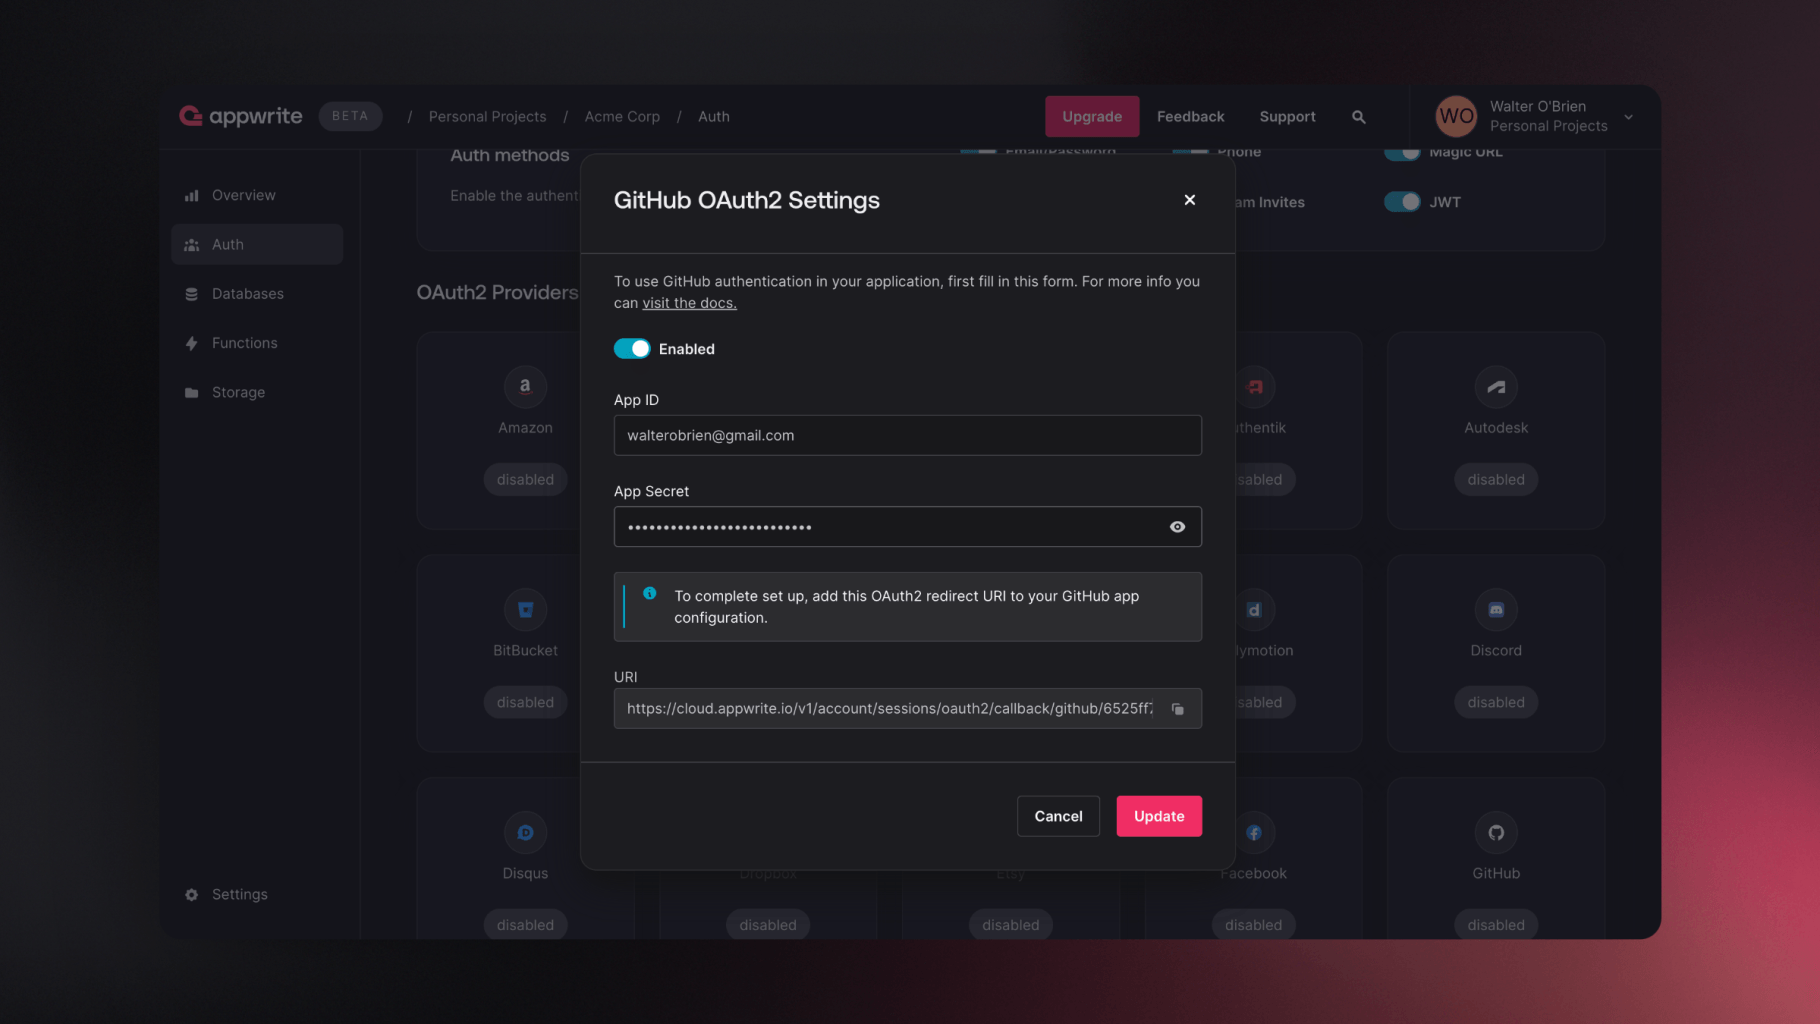
First, you need to associate your GitHub account with your Init ticket. Therefore, we need to create an authentication flow on our website. Fortunately, with Appwrite Cloud, it was quite easy to do so.
By following our documentation on OAuth, and creating an OAuth GitHub App, we're quickly able to create a login flow for Appwrite Init. When logging in for the first time, a new ticket is instantiated and saved to Appwrite Cloud.
Integrating the GitHub contributions grid
Now that the association part is done, it’s time to integrate the more interesting part, the GitHub contributions grid.
There are two ways to achieve this. The first one, is using the GraphQL API. This article was initially used as a source of inspiration when implementing this feature. However, with this data, you only get the number of contributions but not the actual chart.
In GitHub's chart, each square can have a level from 0 to 4, where each level is brighter than the other, indicating more contributions. We need a way to convert those numbers of contributions to levels, but unfortunately, that algorithm is not exposed by GitHub.
We wanted the contribution chart to be as close to reality as possible. So, we arrived at our second solution: getting the chart from the source!
Our website is developed with SvelteKit, which is a full-stack framework. TL;DR, we have control over both the server and the client. So, when someone requests their ticket, we can make the server directly access your GitHub profile page and read the chart! We used a library called node-html-parser to deal with the HTML data.
We then can generate a matrix that representes the contribution chart. Each array of the matrix will represent a week, and each item of said array will contain the contribution level for that particular day.
const res = await fetch(`https://github.com/${gh_user}`);

const html = await res.text();
const root = parse(html);
const table = root.querySelector('table');
if (!table) return null;

const matrix: ContributionsMatrix = [];
const rows = table.querySelectorAll('tbody tr');
const maxCols = rows[0].querySelectorAll('[role="gridcell"]').length;
for (let c = 0; c < maxCols; c++) {
    matrix.push([]);
    for (let r = 0; r < rows.length; r++) {
        const row = rows[r];
        const cells = row.querySelectorAll('[role="gridcell"]');
        if (c >= cells.length) continue;

        const cell = cells[c];
        matrix[c].push(Number(cell.getAttribute('data-level')));
    }

    matrix[c] = matrix[c].reverse();
}
However, this operation is expensive! It's best if we don't have to always fetch it on each and every access to it. So we save it to Appwrite Cloud. By using a number array attribute and converting the matrix to a flat array, this is what our final code will look like.
import { APPWRITE_DB_INIT_ID, APPWRITE_COL_INIT_ID } from '$env/static/private';
import { appwriteInit } from '$lib/appwrite/init';
import parse from 'node-html-parser';
import type { TicketData, ContributionsMatrix } from '../../constants';

export async function getContributions(id: string): Promise<ContributionsMatrix | null> {
    const { gh_user, contributions } = (await appwriteInit.database.getDocument(
        APPWRITE_DB_INIT_ID,
        APPWRITE_COL_INIT_ID,
        id
    )) as unknown as TicketData;

    if (!gh_user) return null;

    if (contributions?.length) {
        // Transform flat array into matrix with 7 columns
        const matrix: ContributionsMatrix = [];
        for (let i = 0; i < contributions.length; i += 7) {
            matrix.push(contributions.slice(i, i + 7));
        }
        return matrix;
    }

    // Code for fetching the matrix here

    // Update the document with the new contributions
    await appwriteInit.database.updateDocument(APPWRITE_DB_INIT_ID, APPWRITE_COL_INIT_ID, id, {
        contributions: matrix.flat()
    });

    return matrix;
}
With this, requests will be much faster. But we still care about the initial load, right? First impressions are everything.
So, we adopted a smart strategy. When requesting the ticket, instead of waiting for all the data to load (the ticket data + the contributions) before rendering the page, we stream the contribution data. This is what our load function looks like:
import { getTicketByUser, getTicketContributions, getUser, isLoggedIn } from '$routes/init/helpers';
import { redirect } from '@sveltejs/kit';

export const load = async () => {
    const loggedIn = await isLoggedIn();
    if (!loggedIn) {
        redirect(307, '/init/ticket');
    }

    const user = await getUser();
    const ticket = await getTicketByUser(user);

    return {
        ticket,
        user,
        streamed: {
            contributions: getTicketContributions(ticket.$id, fetch)
        }
    };
};
Then, with SvelteKit, we can show the contributions as soon as they're ready.
{#await contributions then c}
    {#if c && show_contributions}
        <div
            class="github"
            out:fade={{ duration: 100 }}
            data-remove-delay={removeDelay ? '' : undefined}
        >
            {#each c as row}
                <div class="row">
                    {#each row as level, j}
                        <div style:--index={row.length - j} data-level={level} />
                    {/each}
                </div>
            {/each}
        </div>
    {/if}
{/await}
This means that users can see the ticket without waiting for all data to load but still see the chart seamlessly added to the ticket.
Your tribe
Thomas explained the cool part of how we managed to make your ticket truly unique. But we also wanted to allow for customization so that you could also have a say in what your ticket looked like. For this, we chose to add your favorite technology's logo as a watermark.
Create your own
You can find the entire source code for the tickets on GitHub to create your digital event tickets. In May, we created a showcase site for the Cloud cards on how to add a pop, rotation, and glare to the cards. We advise you to check it out to make your tickets all the more magical.
Although Init is over, you can still get yourself a ticket at appwrite.io/init/tickets
Join us on Discord to be the first to get updates and to be part of a vibrant community!